We all study statistics in our school time as a mathematics subject and think statistics is mathematics?
But do you know what exact statistics do?
NO?
Don’t worry; statistics is not just about solving probability exercises and Data Interpretation. It is much more than that.
Many people do not know the exact statistics definition and other terms used in statistics.
This blog will explore the correct definition of statistics and other terms such as sample, population, etc.
We will also discuss types of statistics and how it works with data. Let’s start with the basic definition of statistics.
Statistics Definition
Statistics is a mathematics branch that deals with the collection, description, analysis, interpretation of data. It covers every aspect of all types of data, such as qualitative data and quantitative data.
In statistics, we use different mathematical theories such as integral calculus, probability theory, algebra, etc., for the various calculations.
Statisticians focus on drawing reliable and accurate conclusions from large data sets and populations. They observe the behavior and other characteristics of small samples and draw a valuable conclusion after analysis.
In simple words, we can say that statistics aims at data manipulation that involves different ways to collect data, review, analyze, and develop conclusions.
Statistics calculations and conclusions are very important for the business organizations and companies to make effective decisions and grow by leaps and bounds.
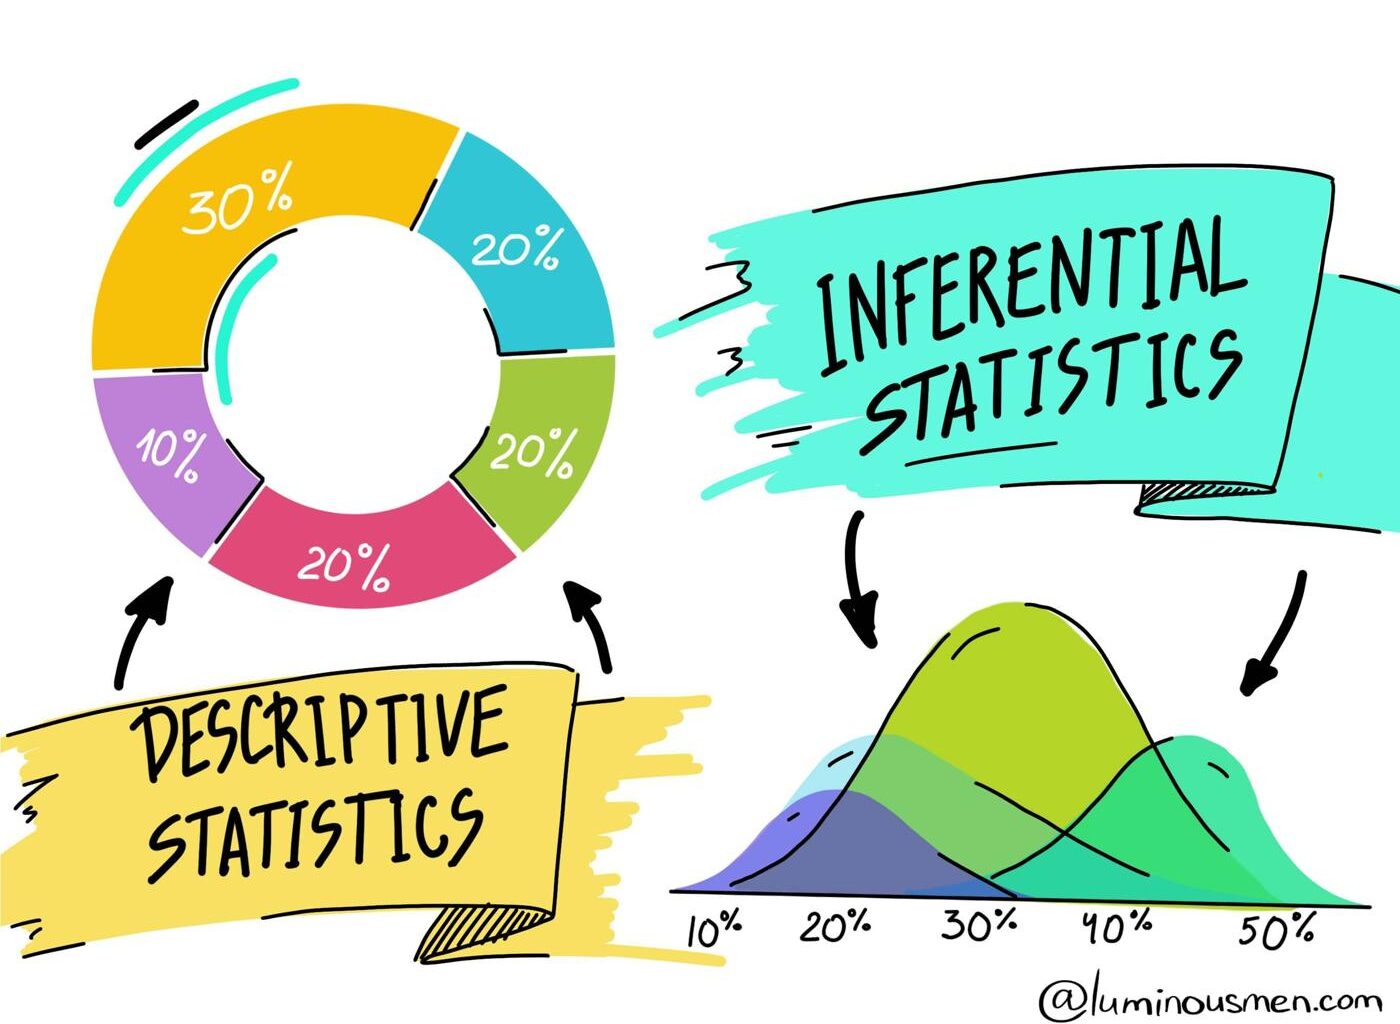
Types of Statistics Methods
In statistics, we use two types of methods: Descriptive and Inferential methods.
Descriptive Statistics: It focuses on the sample data and its central tendency, variability, and distribution. Where central tendency defines the estimate of the element’s characteristics of a sample and population, it involves the mean, mode, and median determination of data. Apart from the statistics definition we should know the definition of other statistical terms.
Variability means a group of statistics that describe how much difference lies among the sample or population elements as well as their observed characteristics. It includes metrics like range, variance, and standard deviation.
Distribution terms indicate the aggregated shape of the data that can be represented on a chart and graph, such as bar graph, histogram, dot plot, etc. It also reveals the difference among measured characteristics of the data set elements.
Descriptive statistics enable us to understand all the properties of the data sample elements and form the hypothesis to make predictions by using inferential statistics.
Inferential Statistics
Inferential statistics aims to draw conclusions on behalf of the characteristics of a population. Statisticians use this type of statistics to make decisions regarding the reliability of findings. In particular inferential statistics is used to generalize large data groups, such as estimating average demand for a product.
It considers the consumer’s habits to predict future scenarios.
In inferential statistics, regression analysis is mostly used in order to calculate the strength and nature of the correlation between independent and dependent variables. Inferential statistics works on the hypothesis and draws the conclusion on the basis of these hypotheses.
Definition of Other Key Terms Apart From Statistics Definition
Population- Population is a particular collection of objects of interest. It covers a large amount of data.A population is not specific to number of people, it can be number of phone calls, number of students, number of products etc.
Sample: Sample is a subset of the population that consists of all the characteristics of the population. If a sample is not having the features of the population, the sample is of no use. To draw valuable information it is important to take a sample that includes all the properties of the population.
Parameter: It is a number to summarize all features of the entire population as a whole. This number describes the entire population such as population mean whereas statistics describe the sample such as sample mean.
Qualitative Data: Qualitative data is classified by its properties, labels, attributes, and other features. It is non-statistical data and can be semi structured or unstructured. It is present in an unfixed form and can not be calculated. For example, “The furniture is made of wood”,is qualitative data.
Quantitative Data: Quantitative data is fixed and easy to determine. This data is statistical data and is always present in descriptive form.
Quantitative data is further divided into two categories: Discrete and continuous data. “I have three pairs of shoes” is Quantitative data.
Outliers: Outliers are the data values that fall out of the data sequence. Too small and too large values in a data set are considered as outliers. These outliers affect the conclusion and outcome of the statistical functions. Due to these unmatched values, a statistician may interpret a wrong decision.
Conclusion
This blog has discussed the statistics definition and other key terms that a student or a business person should know to run the business smoothly. These terms are important to know to avoid any confusion in mind. I hope you will find this blog important for you to know which terms are used in statistics.